A Versatile Stock Market Research Tool for Basic and Advanced Traders.
Problem
With an increase in value investors / long term investors, there is an emerging gap between day traders and value (longer term) investors. While there are tons of tools available for advanced day traders, products for value investors are lacking
Solution
To study the process of varying investor and process of stock market research to solve pain points and come up with potential versatile solutions which caters to day traders and value (longer term) investors.
Product Goals
"To design an intuitive, innovative and versatile platform with features and metrics simmered down to the bare essential, expandable when needed."
Process
1
Research +
Interviews
A diverse variety of traders of varying demographics and expertise level were surveyed to gather information
2
Personas + User Flow
Based on the research and interview, User personas are developed to take us through different use case and user flow
3
Sketches +
Wireframe
After the user flow has been drafted and established, we define and refine the flows to higher fidelity drawings and wireframes
4
Visual Design
Once the wireframes are done, we proceed with styling and branding to present the user with more visual cues for interaction
5
Interaction Prototype
Last but not least, we implement interaction and animation to provide a rich and interactive experience for the users.
Product Research:
3 Main Types of Stock Market Research tools
Stock screeners
Kind of like an advanced filter for stocks, searches the market for shares of certain requirements like market cap, volume, value, etc.
Charting Software
Shows you the performance of the stock over time, day traders use candle stick charting software to decide on buying or selling.
Stock Simulators
Allows users to buy and sell using simulated currency to test hypothesis and strategies
Product Research:
Identifying Key
Data And Metrics
Portfolio metrics measures the performance of the portfolio.
Stock metrics measures the performance and activity of stocks. However there are many different types of metrics, each subjective to the user’s strategy which makes it difficult to establish a hierarchy between metrics.
In this case, industry essential metrics were curated and categorized to basic and advanced metrics.
Key Findings
There are two main categories of users who performs stock market research, basic users who buy stock as a “longer” investment and advanced users who perform day trade, leveraging on different real time data.
- The metrics and data used are different across advanced (day) traders based on their strategy
- More problems to solve for basic traders as it is an emerging and new demographic of user and use case- leverage on news
User Interview
A small sample size of friends and family of varying expertise on stock trading were surveyed to understand the painpoints and process of stock market research here is what we found
User Flow
After user research and empathising with stakeholders on various pain points and decision process, a user flow was studied on how process and features could be improved and innovated to solve these problems.
Wireframes
Elements such as text labels, graphs, buttons, image views were shortlisted for each page. Elements and components were deployed, tested, modified and innovated to define the experience foundation.
Visual Design +
Mockup
After the wireframes were designed and refined, colors which were curated were then deployed. Focusing on an attention to details such as shadow, opacity, shades to deliver the perfect cue for each feature.
Data.
Distilled.
One of the primary issue of stock research apps is the lack of versatility in curating only the essential data, with an onboarding selection tool, users only see data they need.
The Wheel of
Fortune.
Users can easily toggle between chart view and pips view to learn about the gains and loss of their portfolio. They can even toggle to a ring chart view where they can scroll the wheel to navigate to stock.
Versatile,
Yet Expansive
What users see is a distilled and simple view of their portfolio, data and tools, which could then be expanded and toggled for more advanced use case, providing versatility.
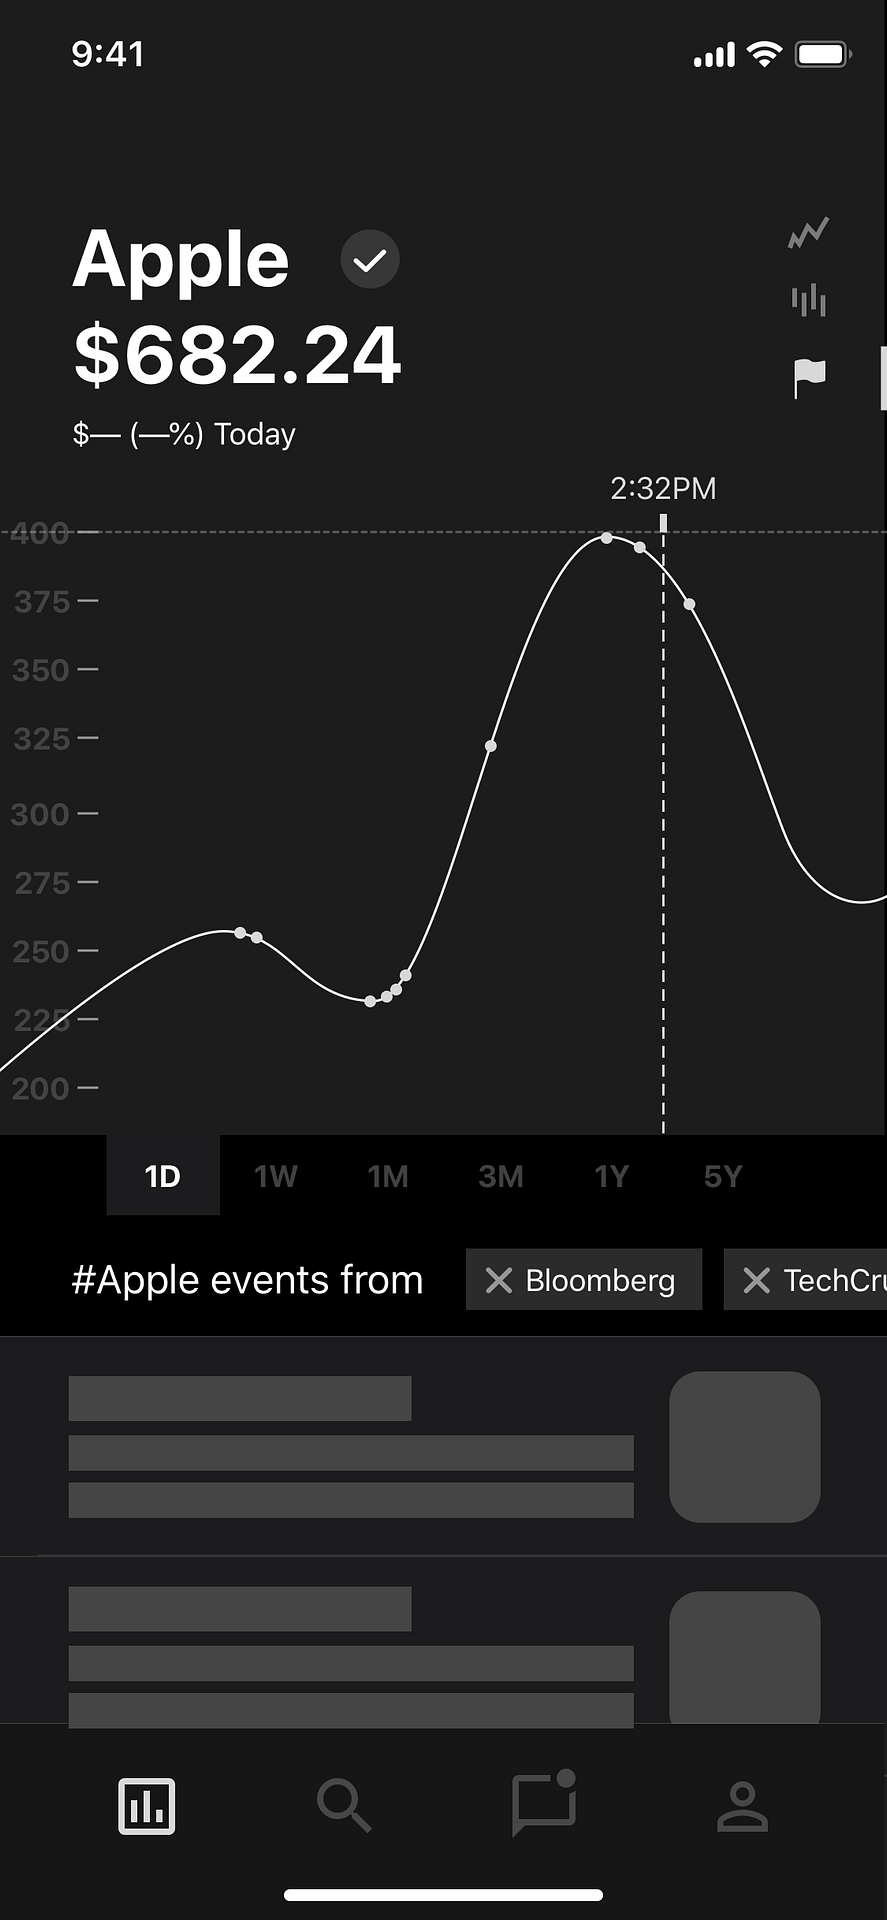
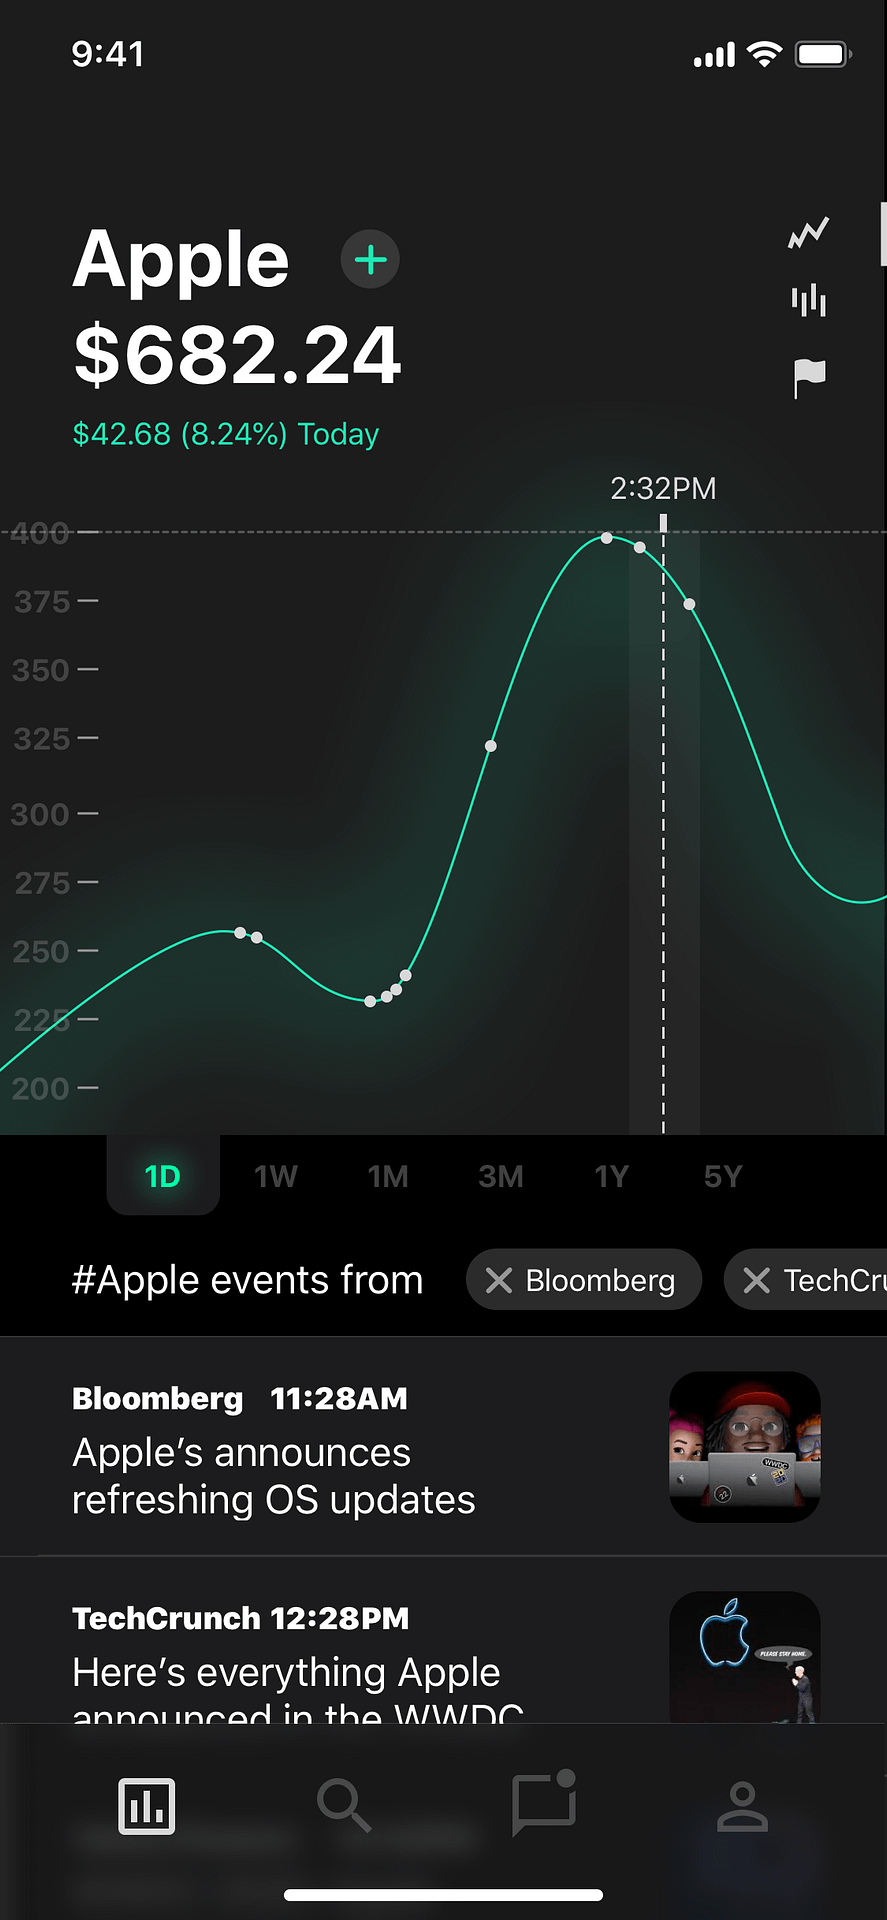
Introducing,
Events.
"Events" is a product which solves an emerging problem for value (longer term) investors. By scrubbing the chart, news section table updates to show the new of the specific timeframe (+/- 1H)
Prototyping
Origami was used to build a prototype and study user interaction strategies as well as structuring various animation parameters, states and conditions for development
Conclusion
It was challenging to design a versatile platform to accommodate basic and advanced users. Recent investment trends have emerged a growing market of long term traders, yet there are short term trader leveraging advanced metrics for complex trading. A versatile design strategy simmers down the complexity with an opportunity to expand when needed, accommodating long and short term traders .
The growing market of long term investors paves way for innovation opportunity. By understanding long term investors workflow, we can design cool features like "events timeline" to provide them a better experience.
It's surprisingly tough to establish a hierarchy. The data and metrics which are required by day traders/ short term investors varies according to their investment strategy. The only hierarchy established between different data set is split by long and short term investors.